What Is Inflation
And what impact does it have on regular people
After the pandemic, the United States recorded some of the highest inflation in decades. This dashboard visualizes inflation and the cause–and–effect relationships behind it.
How Inflation Impacts Regular People
Price change in Housing (MSPUS), Food (CPIUFDNS), and Gas (GASREGCOVW) — the three biggest everyday costs — from 1990 to 2023.


How Inflation Is Measured
Consumer Price Index (CPI)
CPI measures the price change of a basket of consumer goods picked by the US Bureau of Labor Statistics. Food and Energy are sometimes separated out because of their volatility.
CPI Over Time
Index value 1960–2026 · FRED CPIAUCSL. Post-pandemic inflation is the steepest surge since the Volcker era.
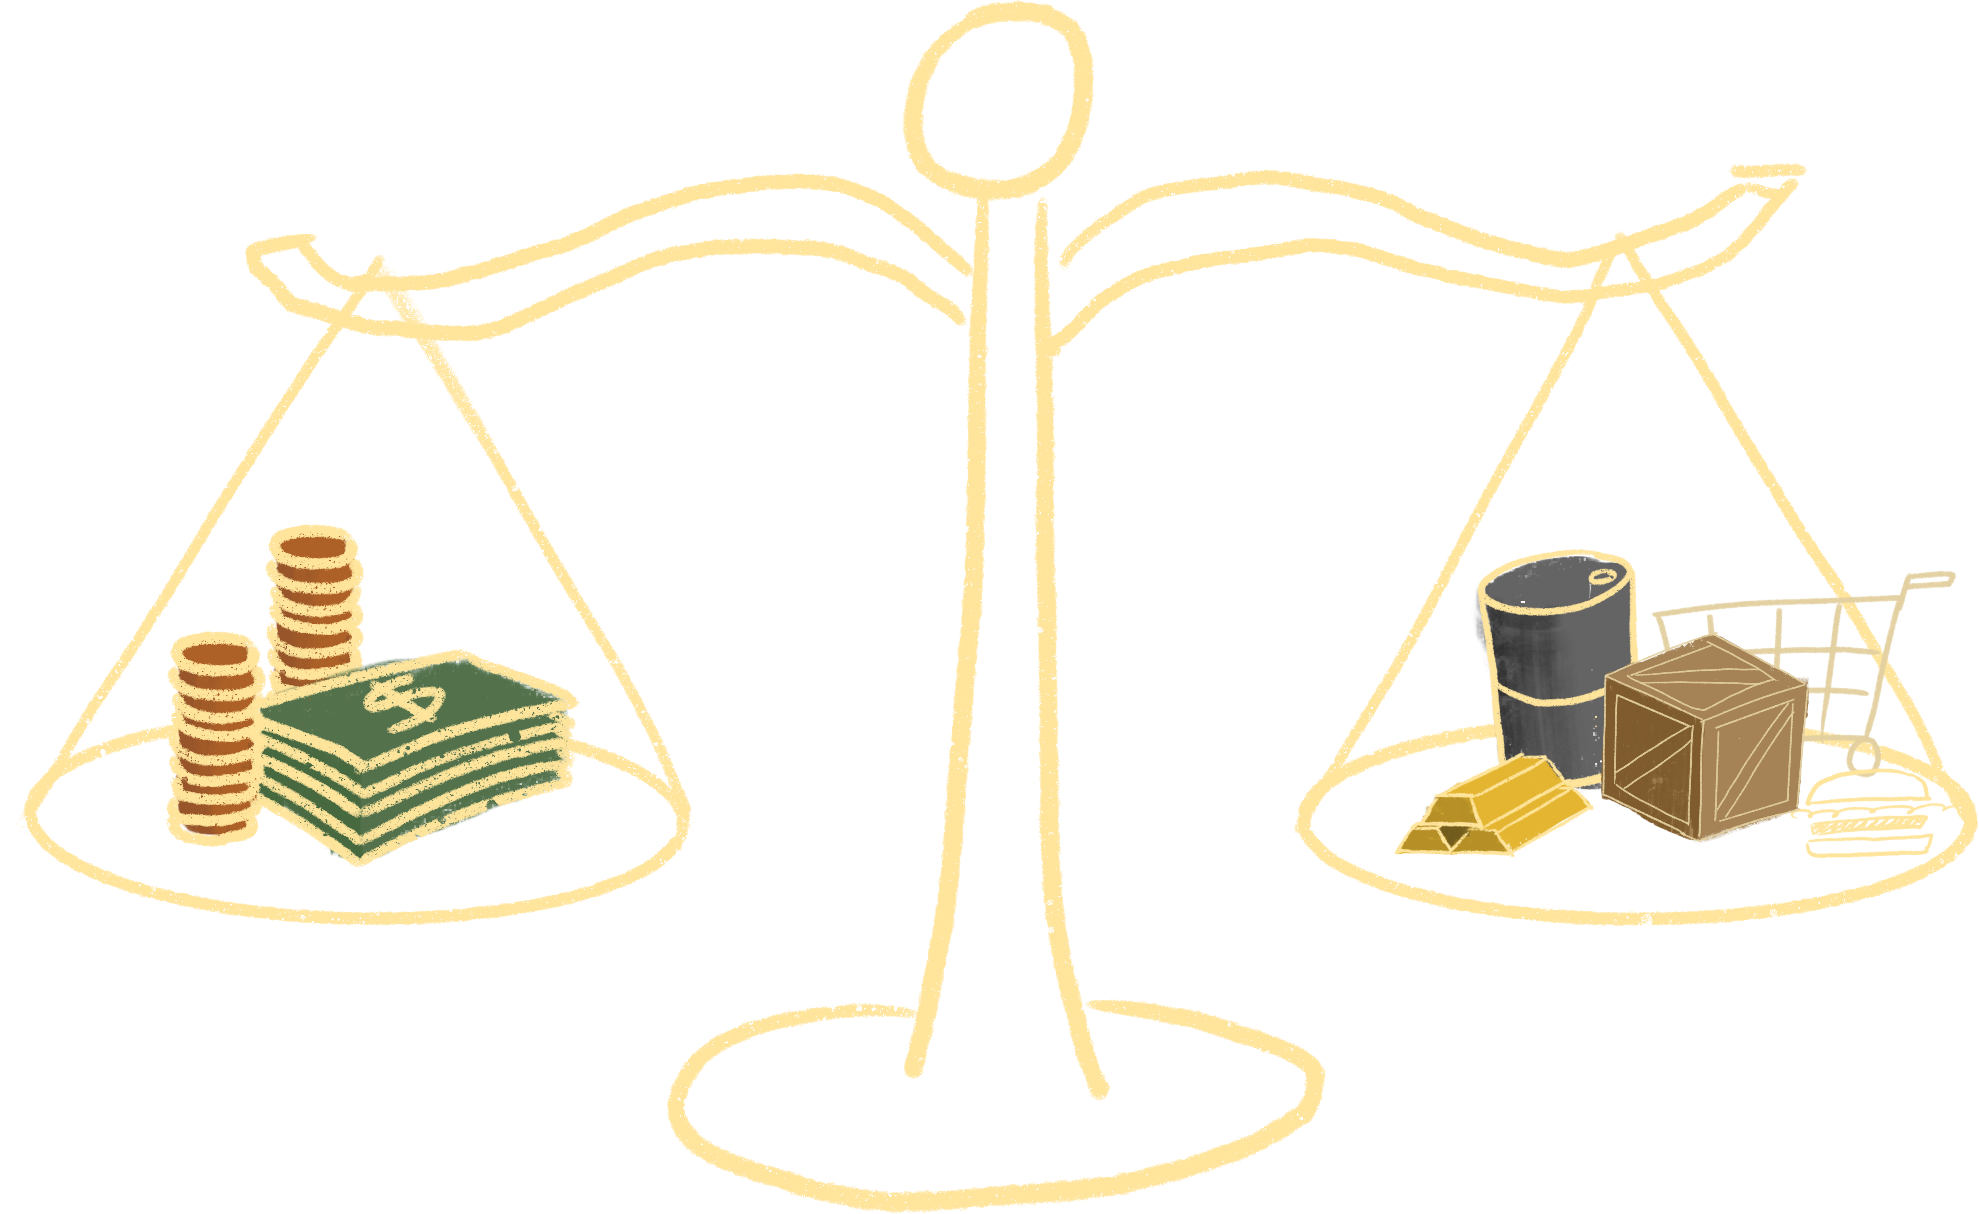
What Causes Inflation
When the amount of money and credit chasing goods grows faster than the supply of those goods, inflation follows.
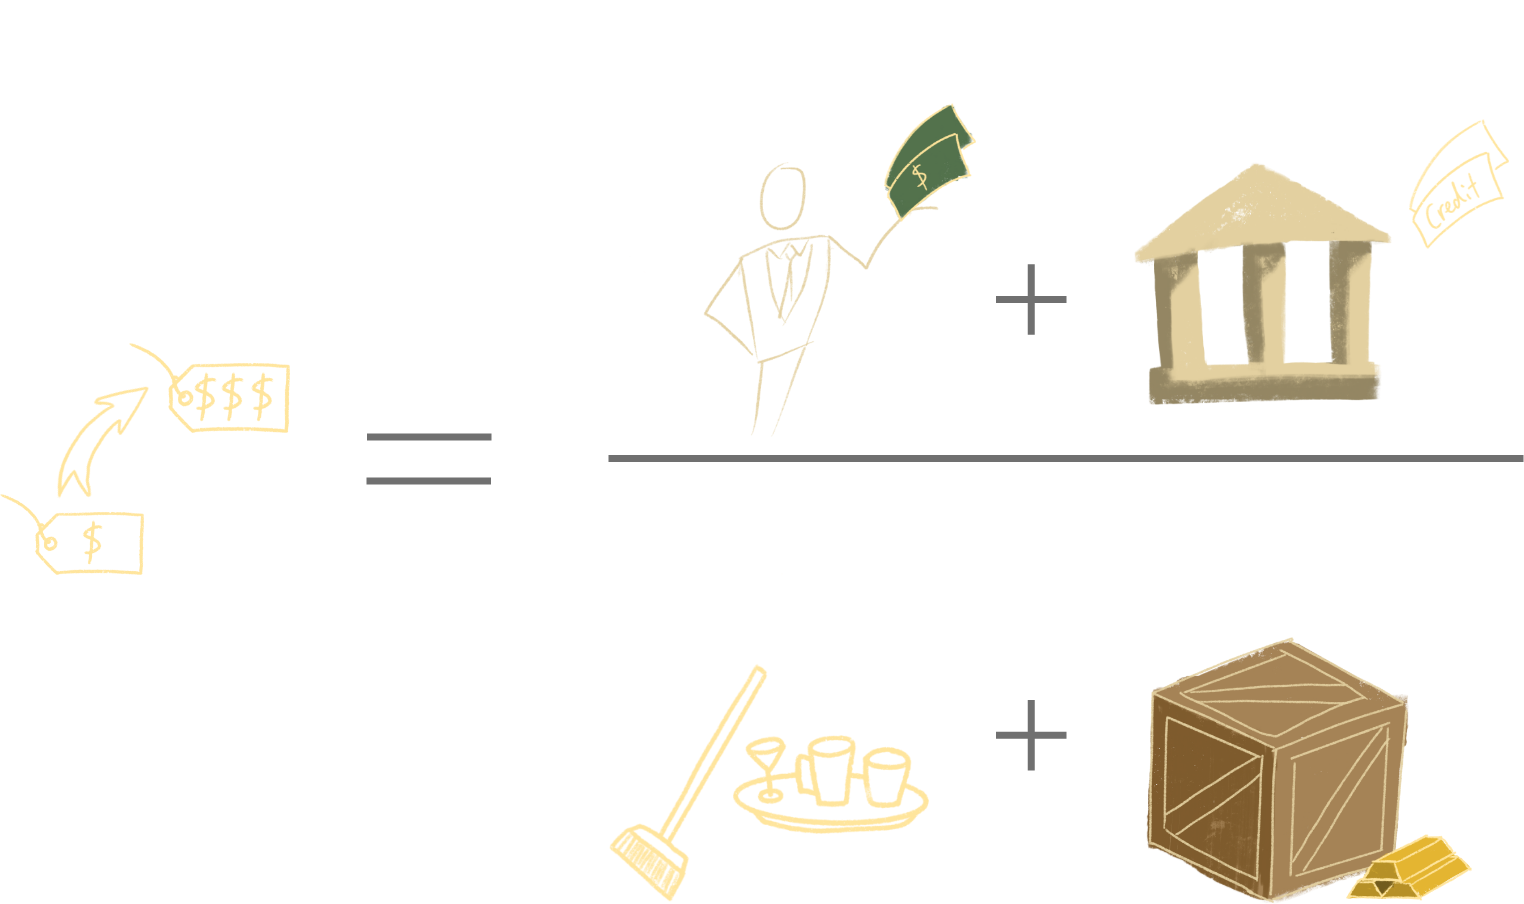
“…inflation is equal to the change in the amount of money and credit spent on goods and services divided by the change in the quantities of goods and services sold.”
Post-pandemic "easy money" flooded markets: central banks held interest rates low while government spending surged, tilting the balance toward inflation.
Money Supply vs. Inflation
M2 (money supply) growth and CPI (inflation) track each other closely across 65 years of booms, busts, and crises.
M2 vs CPI · 1960–2026
Year-over-year % change. Recessions shaded in gray. Annotated: Stagflation, Dot Com Bubble, 2008 Financial Crisis, COVID-19.
M2 × CPI Scatter
Each dot = one year. Normal years cluster low-left. The 70s stagflation climbs into the top-right. COVID is the outlier — extreme M2 growth with delayed CPI response.
Interest Rates, Gold & QE
The Fed Funds Rate is the primary tool for controlling inflation. Two historical milestones shaped today's regime.
Federal Funds Rate
Strong positive correlation with inflation. When rates rise, borrowing and spending slow.
1971 · End of the Gold Standard
President Nixon unilaterally cancelled the direct convertibility of the US dollar to gold, ending the Bretton Woods System.
2008 · Quantitative Easing (QE)
A novel monetary policy used when inflation is very low or negative and standard policy is ineffective. Some call it money printing.
Everyday Prices Since 1990
Three charts tracking the cost of living for the average American household.